

The GenAI landscape is moving faster than ever. With over 95% of enterprises expected to deploy multiple GenAI models by 2028 (Gartner, 2025), GenAI adoption is no longer the hurdle, the real challenge is selecting the right model for real-world workloads.
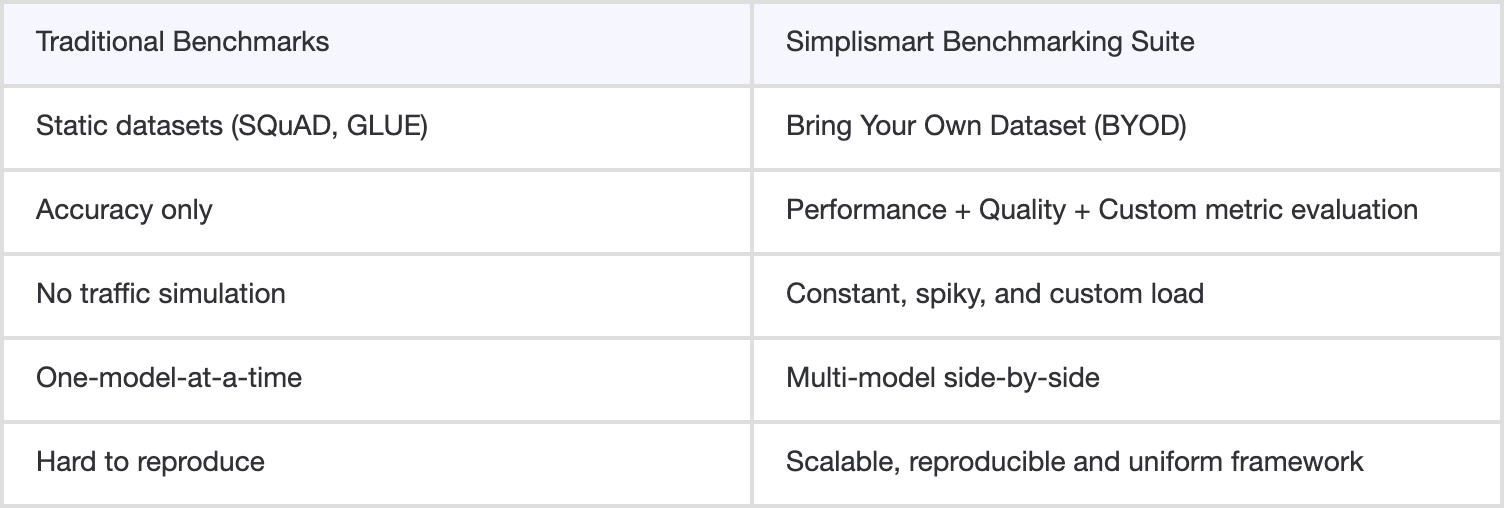
Traditional benchmarking approaches fall short. They often measure accuracy on static datasets but fail to capture latency under heavy load, throughput at scale, or performance with domain-specific inputs. The result: engineering teams are left guessing which model will truly hold up in production.
That’s why we built the Simplismart Benchmarking Suite, the first-of-its-kind framework for benchmarking GenAI inference in real-world conditions. From multi-model comparisons and spiky load tests to advanced evaluation metrics and custom datasets, it delivers the clarity needed to make confident, data-driven decisions about model adoption.
Let’s understand the challenges teams face today when trying to benchmark GenAI models.
What are the Challenges in Benchmarking GenAI Models?
Benchmarking GenAI isn’t straightforward and most existing tools were never designed for large-scale inference. Teams typically face:
- Fragmented evaluation: Relying on homegrown scripts that measure only partial performance metrics.
- Vendor bias: Published benchmarks often represent best-case results under vendor-optimized conditions.
- Scaling blind spots: Lack of tools to simulate spiky or real-world traffic across diverse model architectures.
- Quality gaps: Metrics like BLEU or ROUGE focus on surface accuracy, missing deeper elements like faithfulness or bias.
- Reliable benchmarking tools: Simulating production-level benchmarking requires proper setup and scalable infrastructure which is difficult and expensive to build in-house.
- Non-uniformity / non-reproducible benchmarks: Even minor differences in datasets, load patterns, or token configurations can lead to inconsistent results, making it hard to compare models reliably over time.
The Simplismart Benchmarking Suite solves this by bringing together distinct but complementary modes for benchmarking GenAI across Performance and Quality which are designed to capture the full spectrum of GenAI behavior.
A core feature of the suite is running benchmark tests that compare multiple models on the same dataset and configuration. By selecting multiple deployments, teams can run side-by-side tests under identical parameters across the same input/output token sizes, load patterns, and evaluation metrics for true apples-to-apples results.
This ensures that performance, quality, and reliability comparisons are consistent, reproducible, and actionable, eliminating guesswork and vendor bias in model selection.
1. Performance Benchmarking: Measuring How Models Scale in the Real World
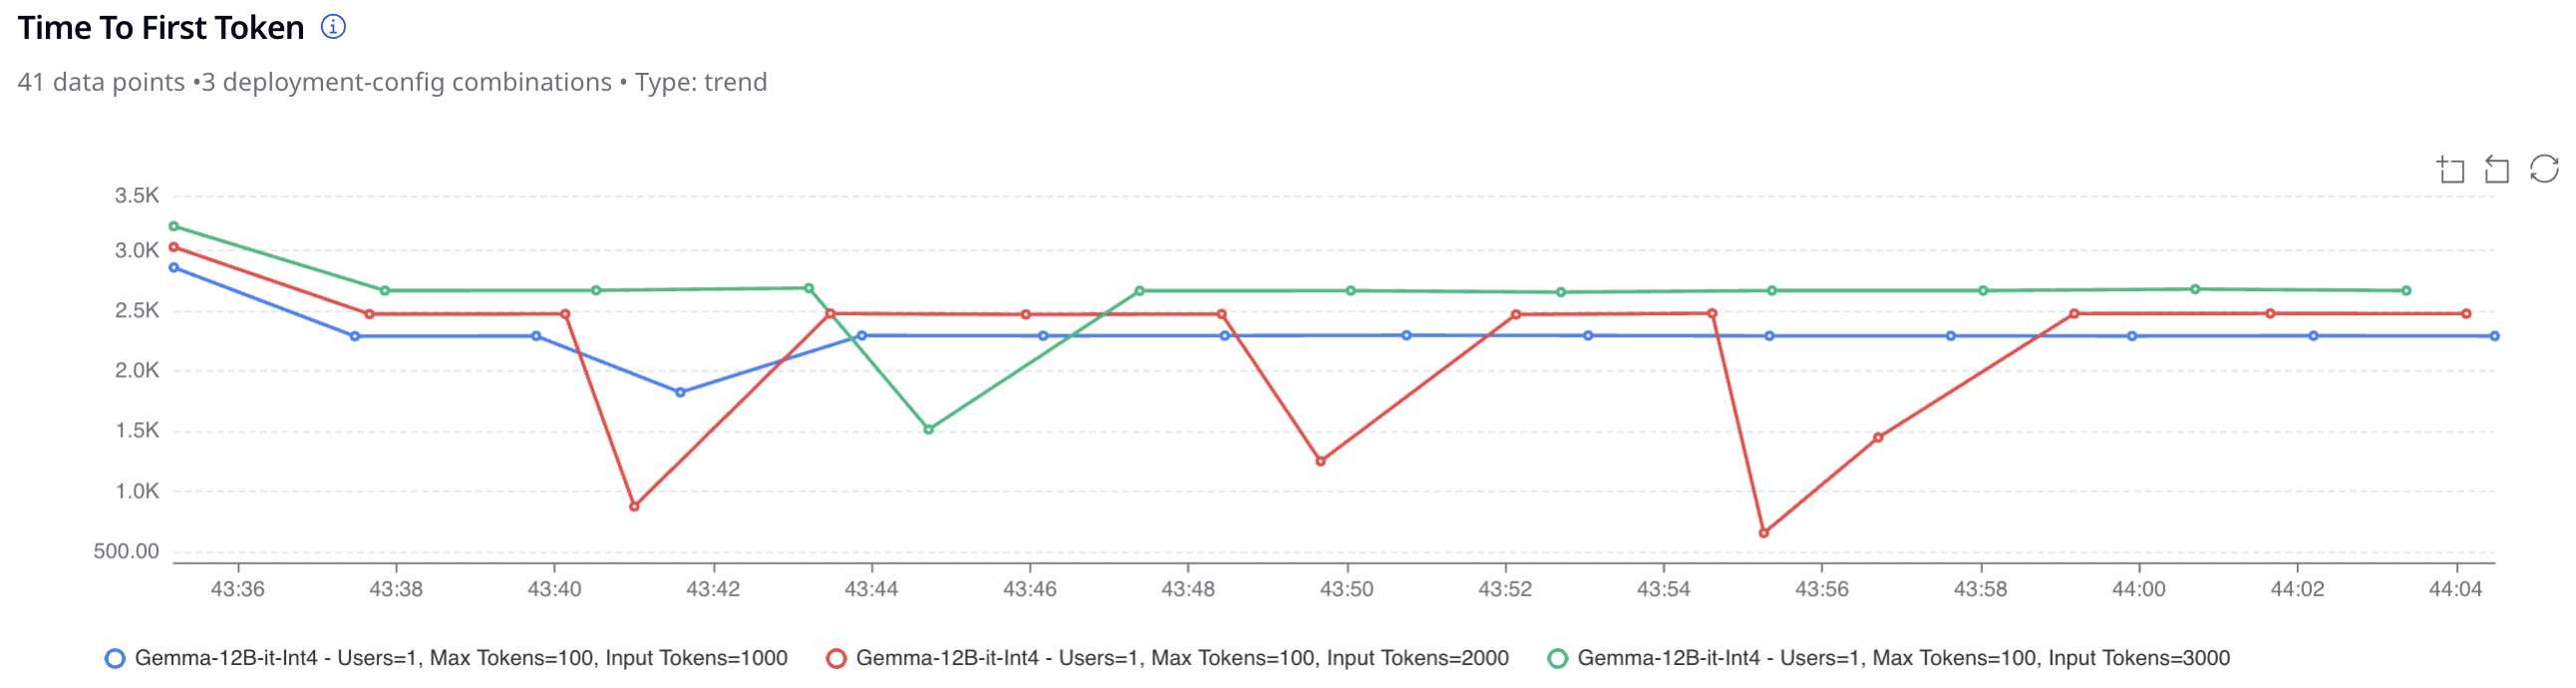
When GenAI workloads hit production, inference efficiency matters as much as accuracy. Simplismart’s Performance Benchmarking module brings rigor to benchmarking GenAI, letting teams mirror real deployment behavior under controlled, configurable conditions and compare GenAI model performance with confidence.
What You Can Configure
- Chat datasets: Input your dataset (e.g., chat logs, prompts, user queries).
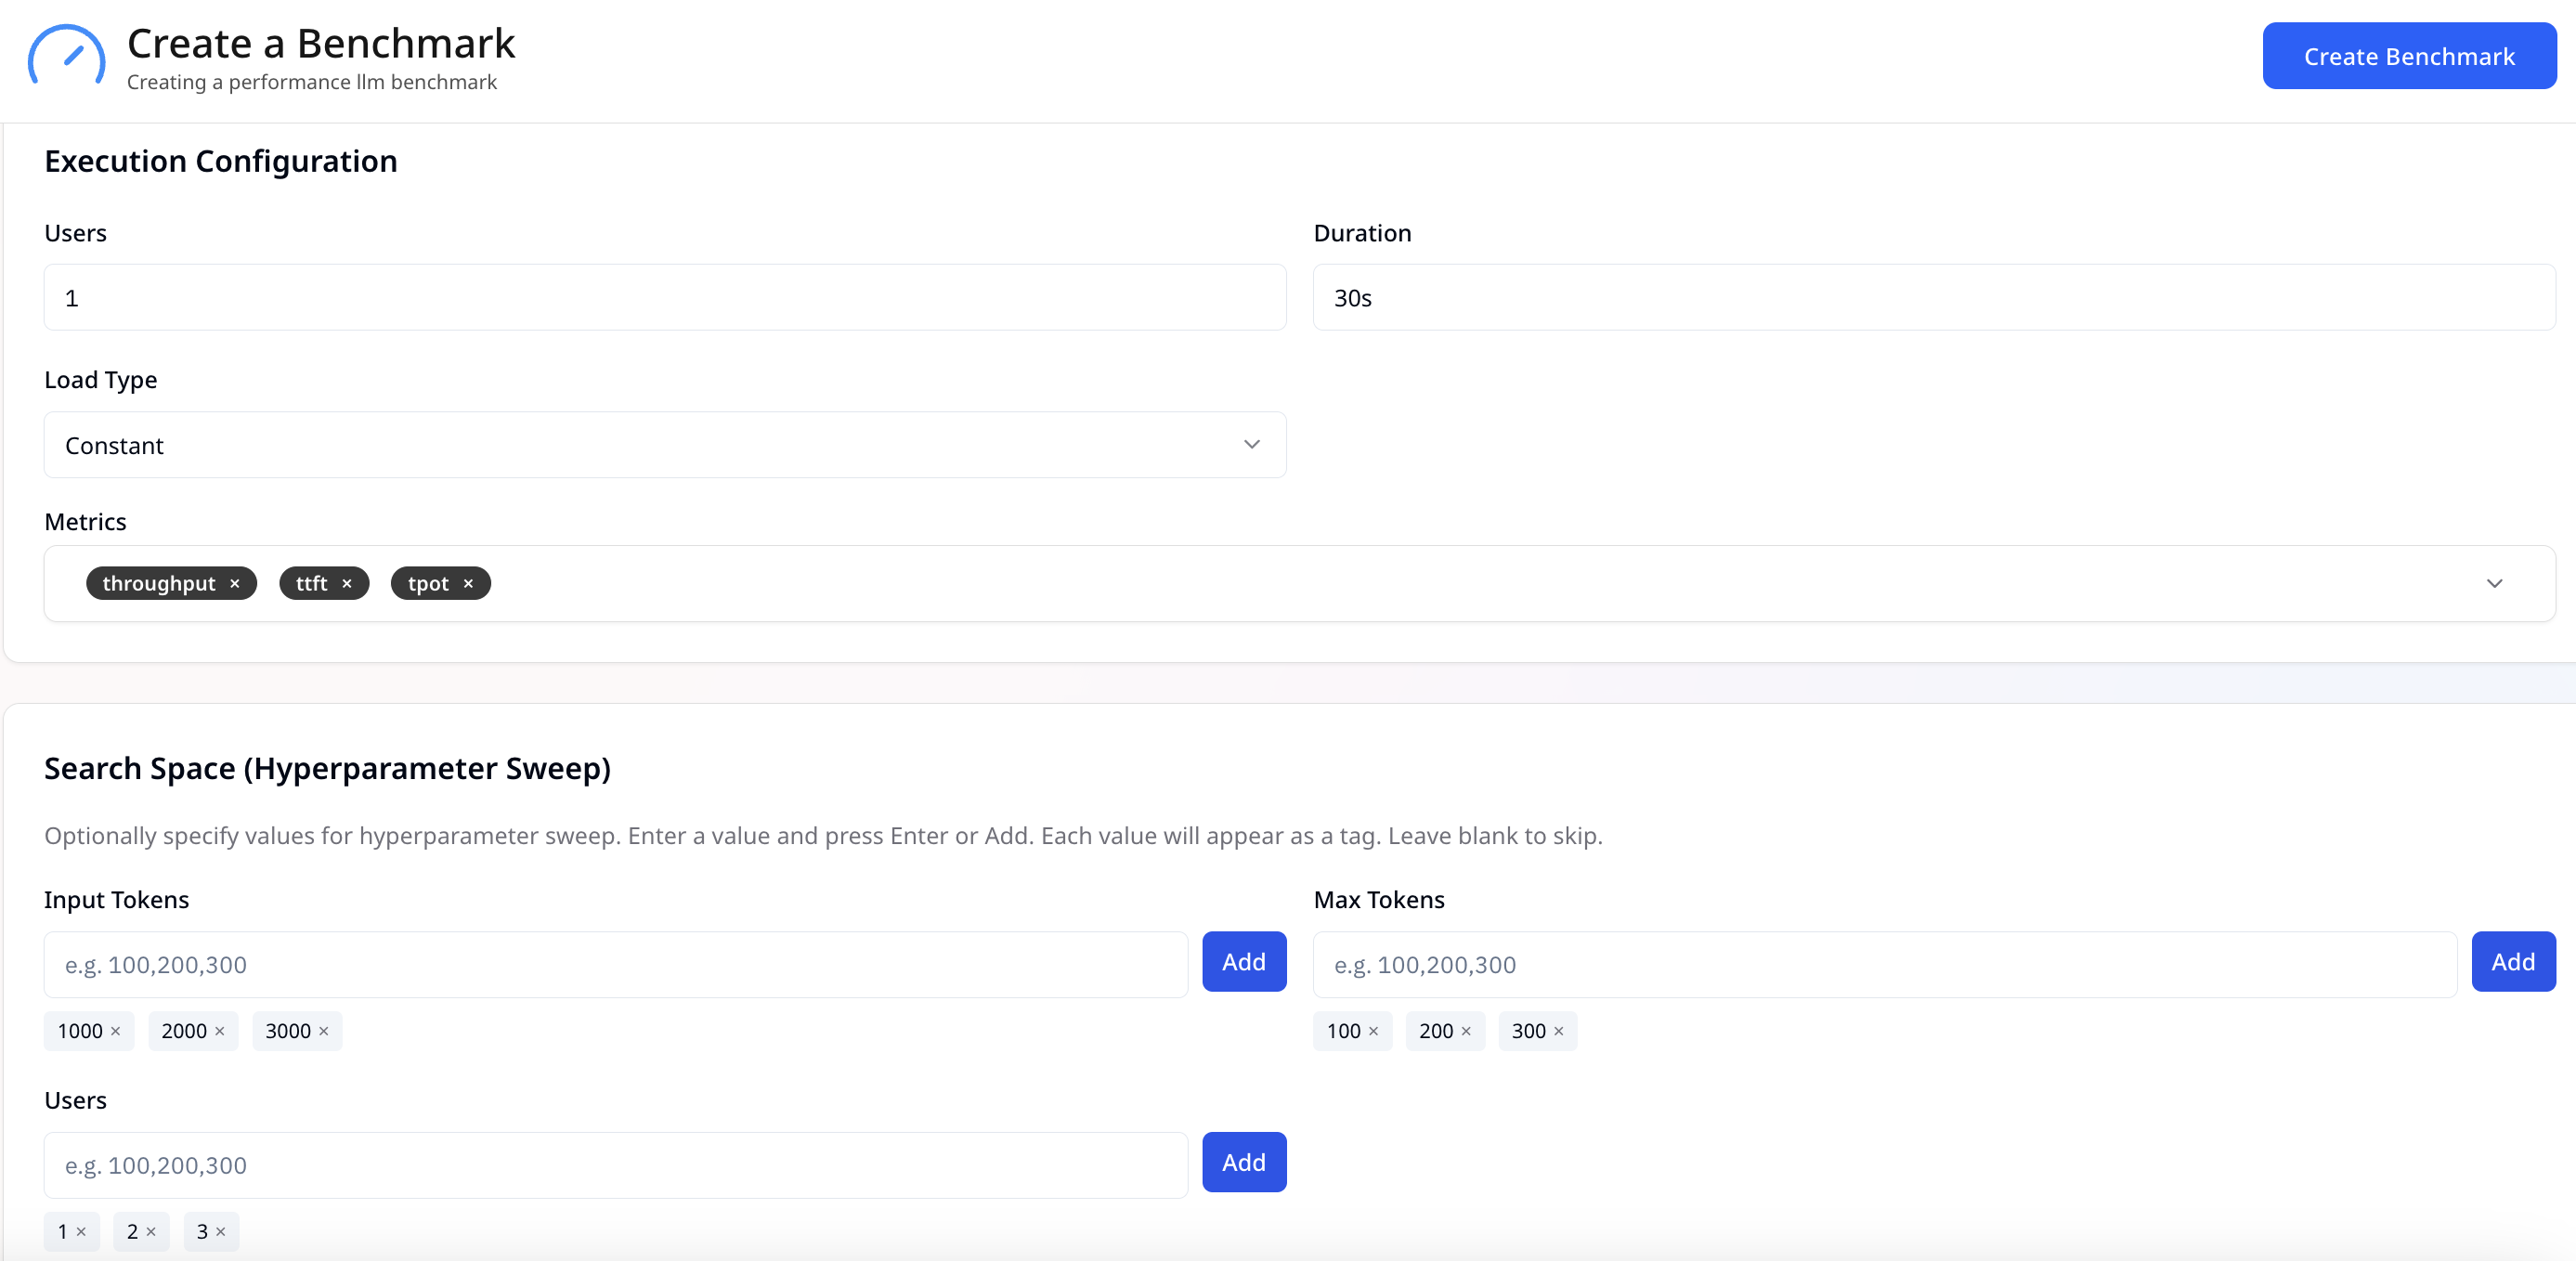
- Execution parameters: Define the number of concurrent users, input-output token lengths, and load patterns.
- Load patterns: Simulate
- Constant load: Steady traffic volume.
- Custom load: Reflects dynamic, real-time usage.
What It Measures
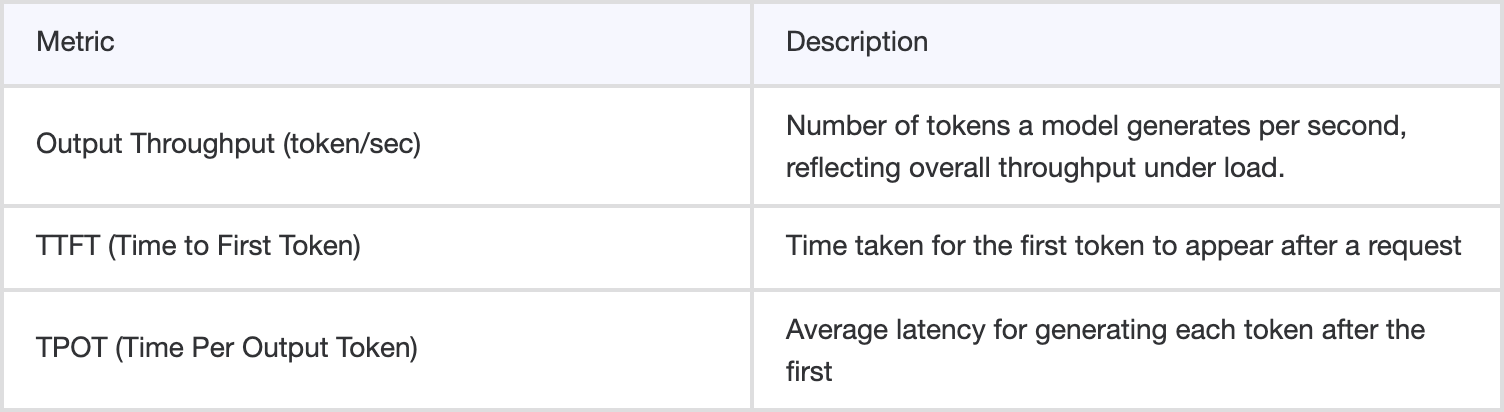
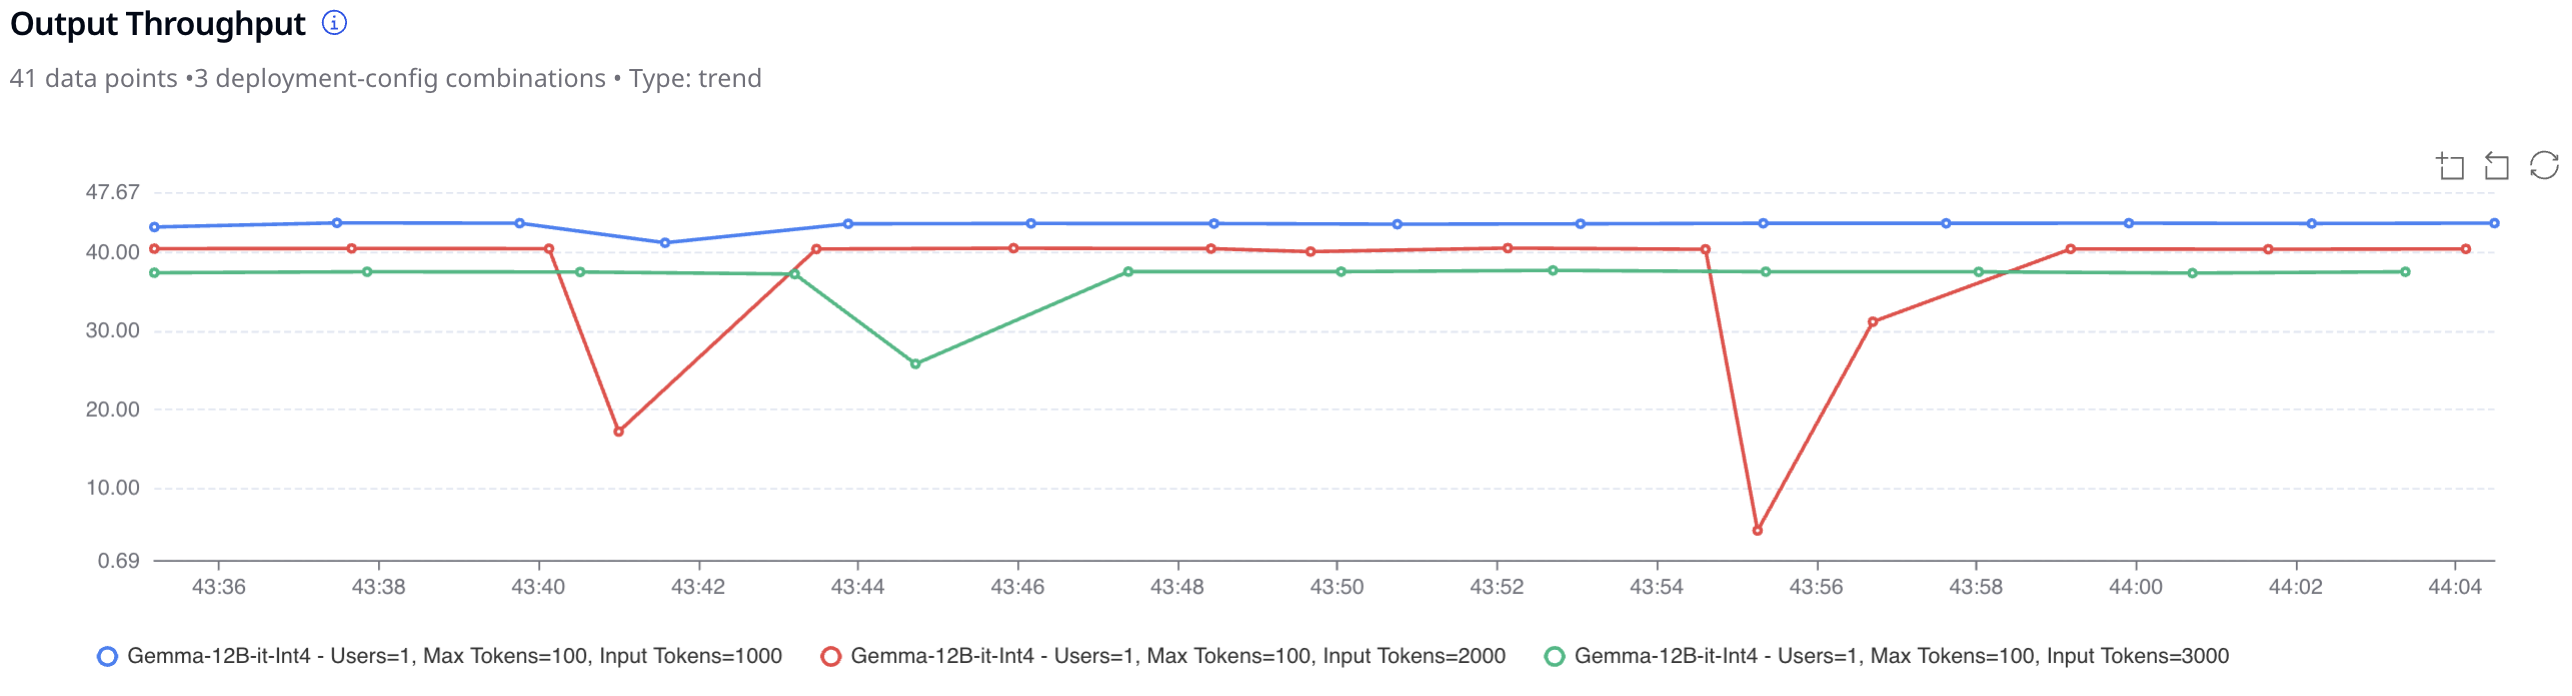
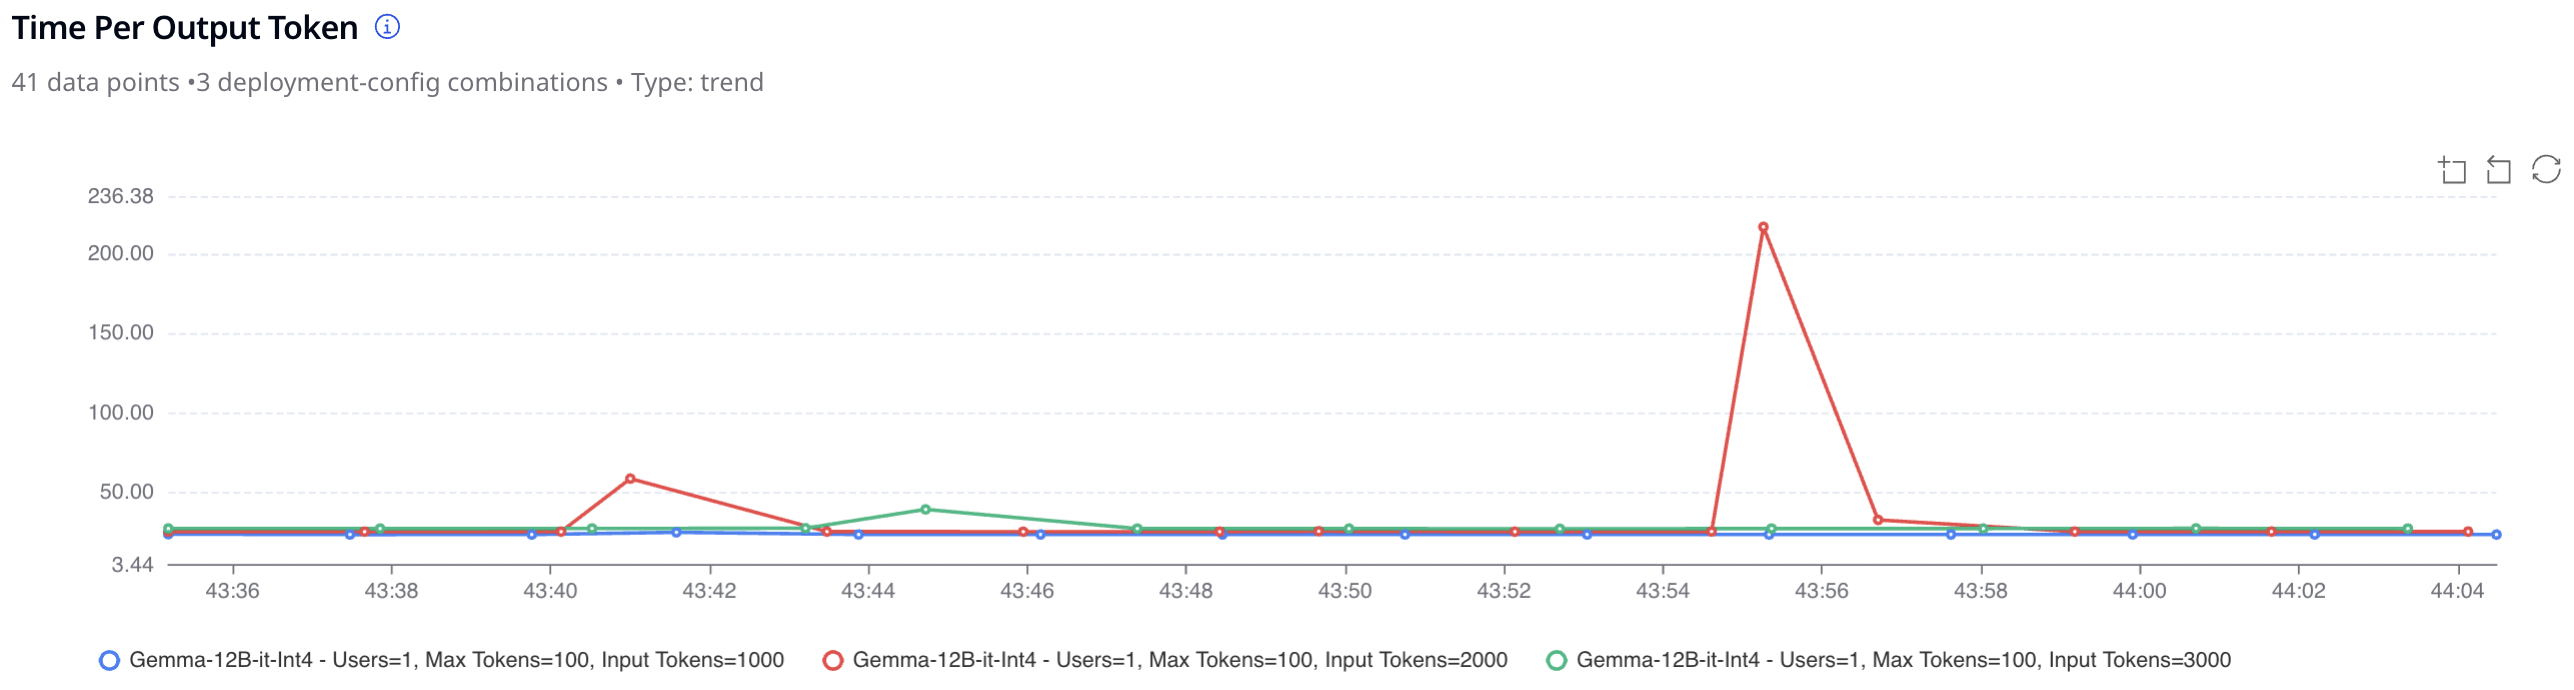
These key metrics together help determine model responsiveness and scalability which are crucial for production scenarios like real-time chatbots or speech assistants where latency defines user experience.
Example
A customer support bot team can simulate 2,000 concurrent users sending varied-length prompts to compare Llama 3.3, Qwen 2.5, and Mistral 7B, observing not just which is faster, but which sustains throughput during peak load.
2. Quality Benchmarking: Evaluating Model Accuracy and Reliability
Model performance is only half the story output quality matters just as much. Simplismart’s Quality Benchmarking module provides a robust way to evaluate a model’s accuracy and linguistic quality across 50+ curated datasets and evaluation parameters.
What You Can Configure
- Dataset selection: Choose from 50+ preloaded datasets spanning a wide range of tasks, including:
- Text generation: Summarization, Q&A, and dialogue.
- Coding & reasoning: Programming/code evaluation and logic-based problem solving.
- STEM-focused tasks: Math, science Q&A, and general knowledge reasoning.
- Translation & multilingual tasks: Evaluate language models across multiple languages and contexts.
This allows LLMs to be rigorously evaluated across diverse domains, ensuring a comprehensive understanding of their strengths and weaknesses.
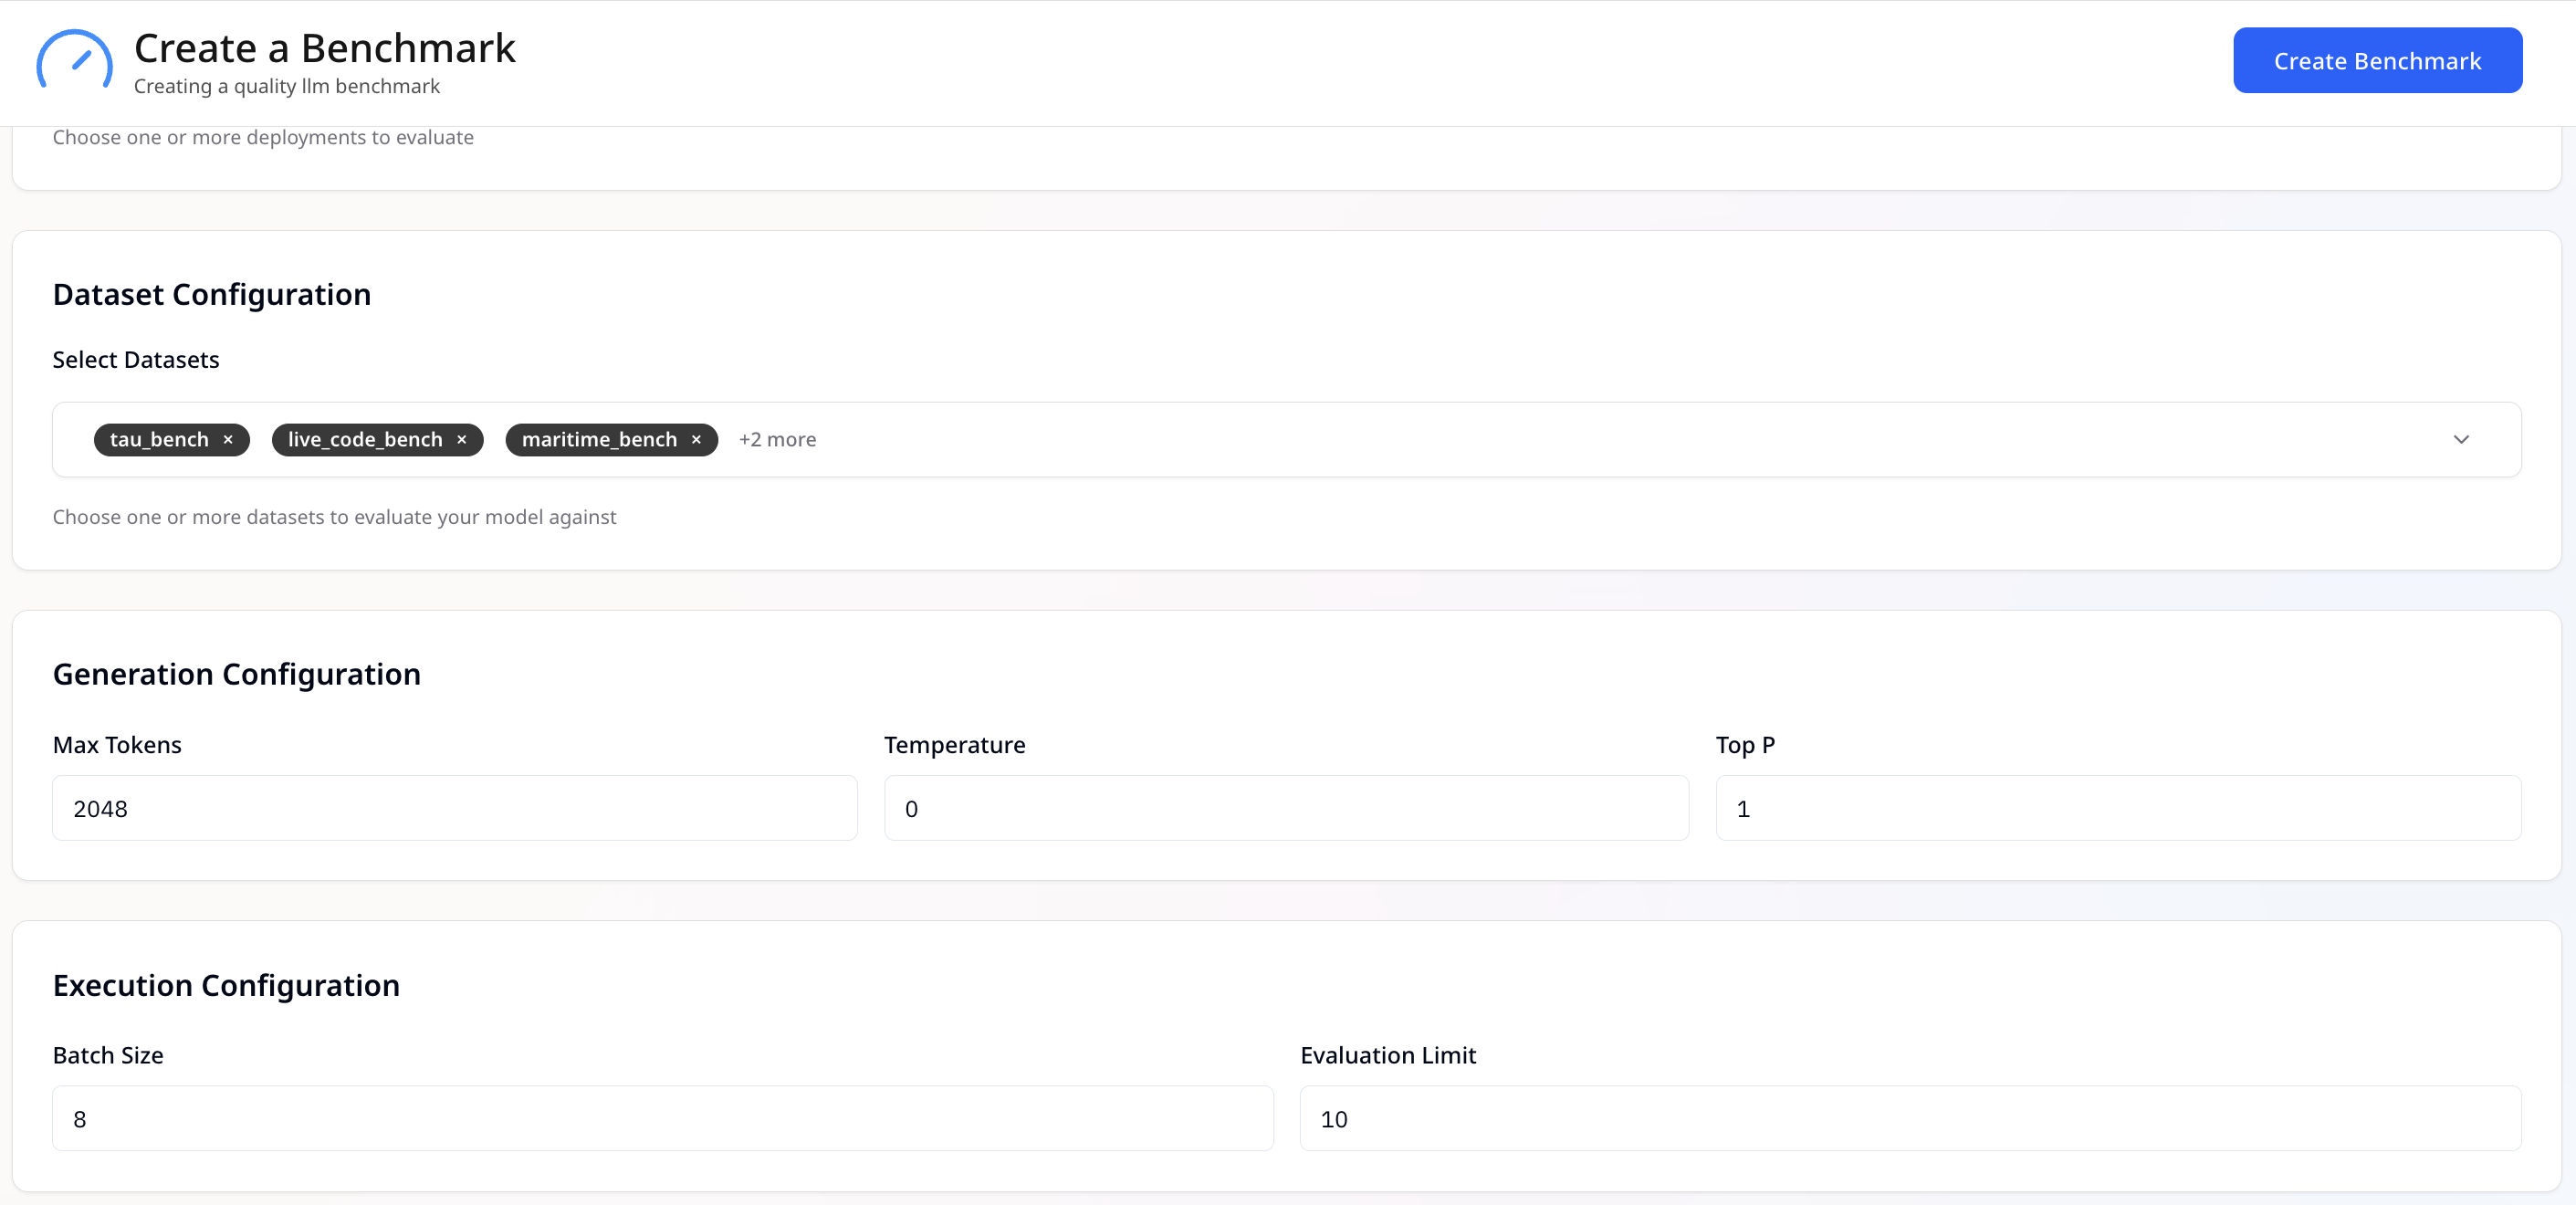
- Execution controls: Fine-tune benchmark runs to match your evaluation needs by adjusting:
- Batch size: Control the number of requests processed simultaneously to measure model efficiency under different load conditions.
- Maximum tokens per output: Set limits on response length to simulate real-world usage scenarios.
- Evaluation limit: Run benchmarks on a subset of the dataset for quicker iteration, especially useful for large-scale evaluations.
What It Measures
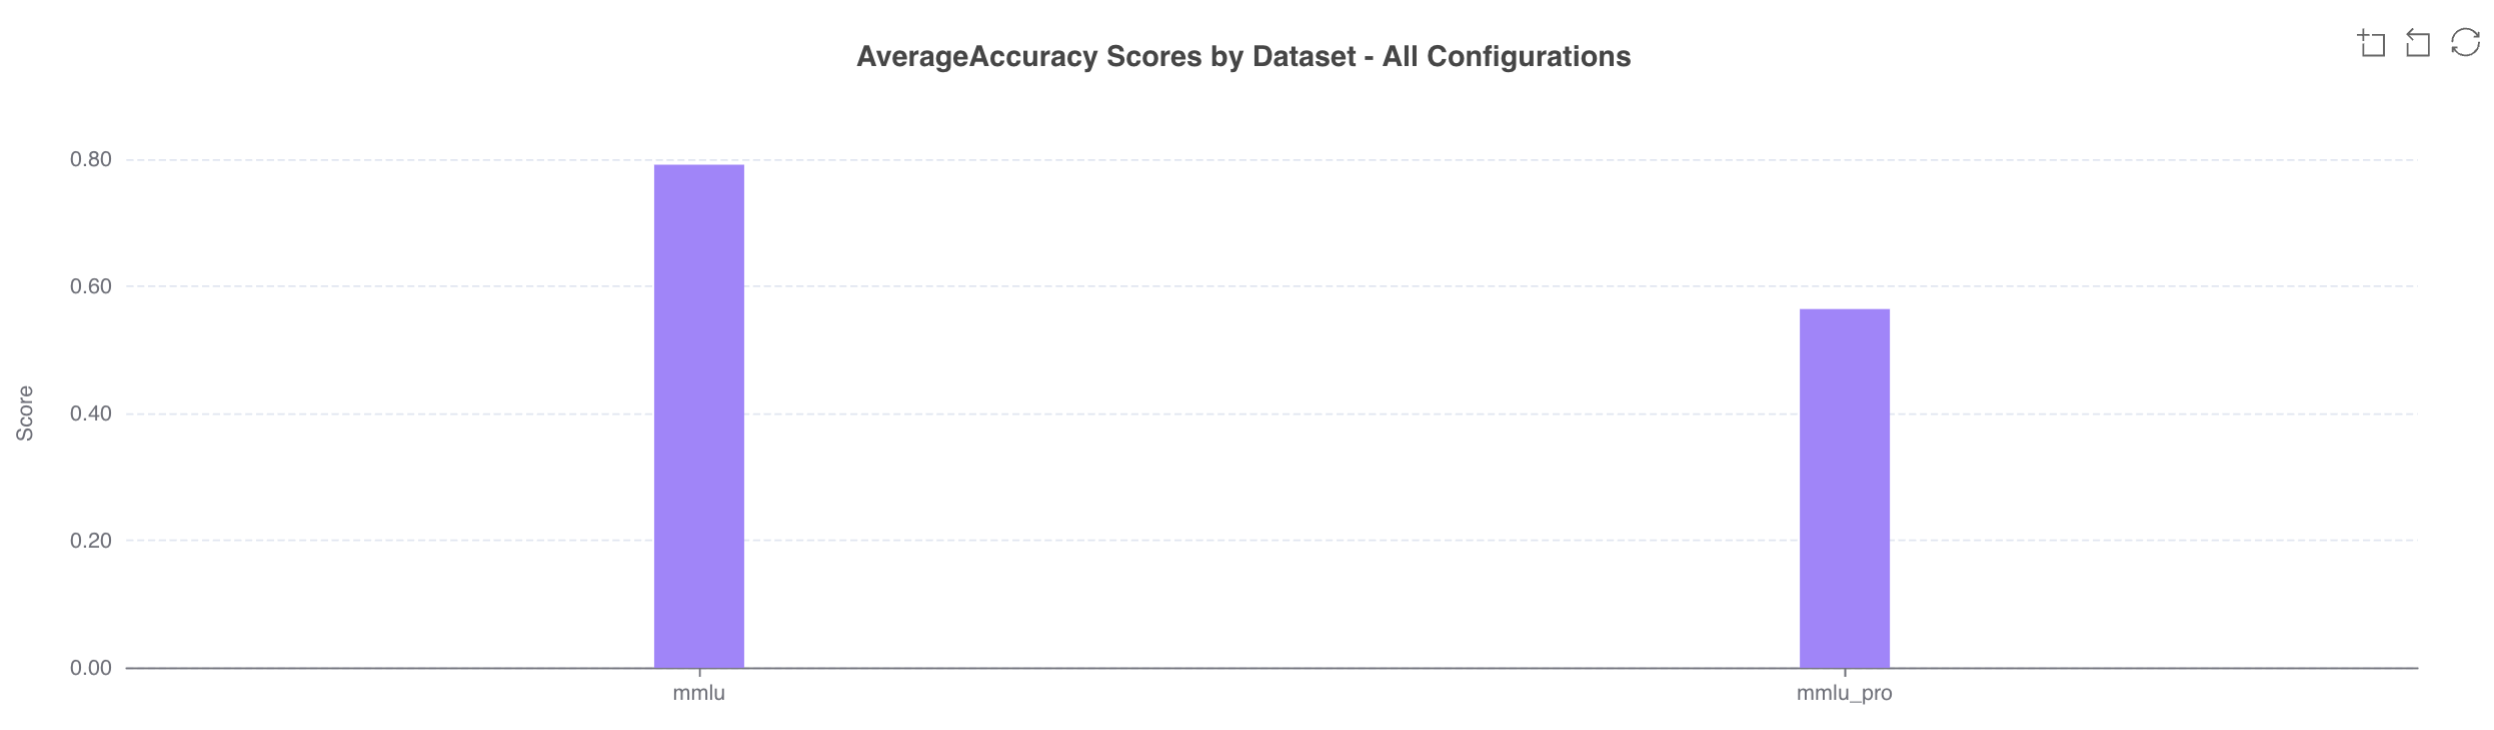
The benchmarking suite evaluates model outputs to produce accuracy scores (%) based on the selected datasets, reflecting how well each model performs on the given tasks.
How Simplismart Compares to Traditional Benchmarks
Closing Thoughts
Inference in today’s times is defined by three things: trust, cost, and performance at scale.
Simplismart Benchmarking Suite sets a new industry standard by combining real-world performance testing, deep quality evaluation, and advanced custom benchmarking all within a unified, repeatable framework.
Whether you’re optimizing for latency, evaluating accuracy, or testing domain-specific reliability, Simplismart helps you make evidence-backed decisions that scale.
Currently available for LLMs, we’ll soon extend this capability across all modalities including image, voice, and multimodal workloads.
👉 Get started with Simplismart Benchmarking Suite today
👉 Read our Benchmarking Documentation